Email Marketing Benchmarks: How Do You Stack Up?

When curating a email marketing strategy, it’s important to assess your current performance and set defined goals to work toward.
But how do you determine a reasonable target? Without context, something like a 75% open rate could sound like a great goal, but in reality it’s pretty unrealistic.
This is where benchmarks come into play.
Significant Email Marketing Benchmarks
A benchmark is a “standard or point of reference against which things may be compared or assessed,” and email marketers use them to evaluate the performance of their efforts.
Standard email marketing benchmarks include:
- Open Rate: the percentage of the total number of subscribers who opened an email campaign
- Click-Through Rate: the percentage of the total number of subscribers who clicked a link or image, regardless of whether the subscriber opened the campaign
- Click to Open Rate: the percentage of subscribers (who actually opened the email) who clicked on a link or image
- Unsubscribe Rate: the percentage of subscribers who unsubscribe through an email campaign
- Email Bounce Rate: the percentage of emails that did not make it to a subscriber’s inbox (can be either a soft or hard bounce)
Referencing benchmarks can help find out how your email marketing efforts and performance stacks up against the industry average.
How Do You Stack Up?
If you’re a Mailchimp user, you can quickly reference how your campaign performance compares to your industry average within the campaign report:
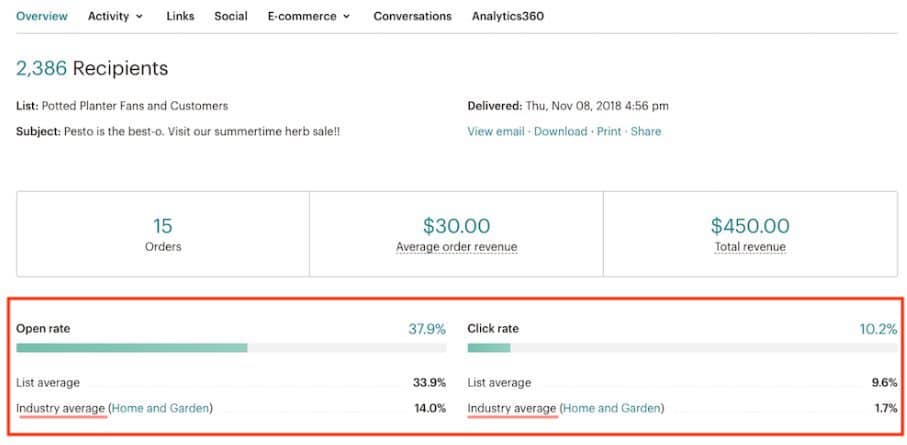
Across all industries, Mailchimp’s email marketing benchmarks and statistics report that the average open rate is 21.33%.
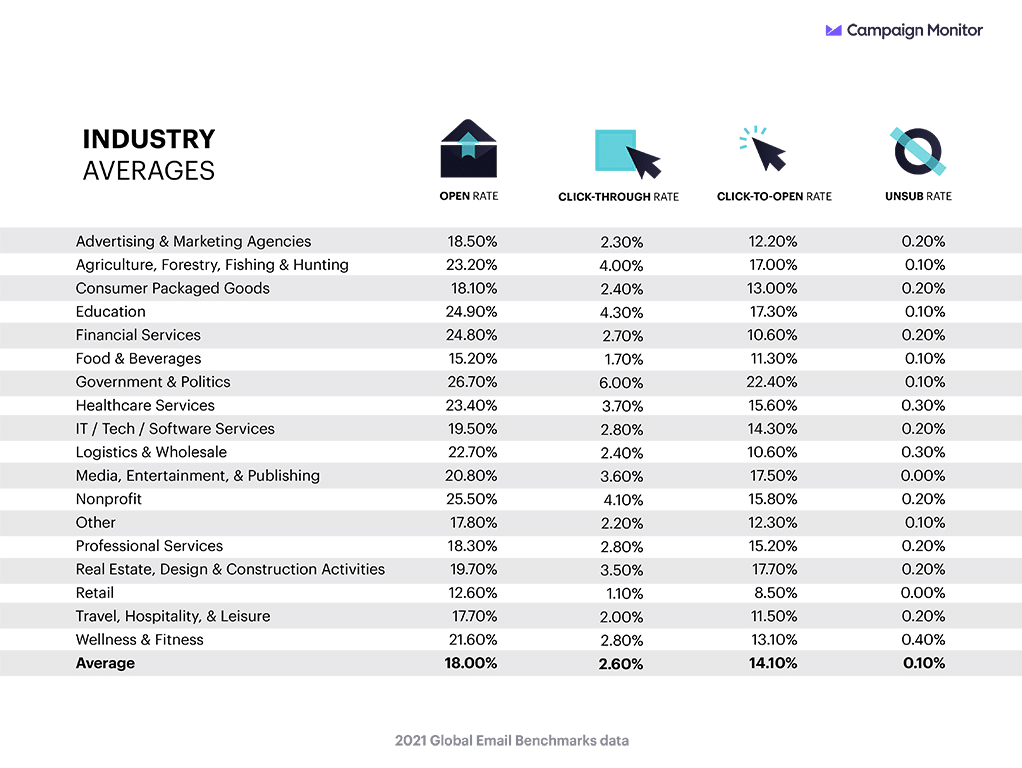
Similarly, Campaign Monitor (below) reports an average of 18%.
But while it can be very helpful to learn how your competitors are performing, every email audience is unique. Depending on your brand’s industry, product, and your audience’s geographic location, benchmarks may not be applicable to you.
Email marketing experts differ in their opinion regarding whether benchmarks are relevant to their campaigns. Some do extensive research for email benchmarks that match their specific country and industry. Others focus less on benchmarks and more on internal product sales.
If your average open rate is 15%, but the industry average is 20%, that’s good to know.
But what’s more important is knowing how your email campaigns are comparing to your internal stats over time. Maybe 15% is 5% higher than last year — if so, then that’s great!
Tl;dr: There are times to consider benchmarks, and times to take benchmarks with a grain of salt and just focus on your own data.
Food For Thought
Ok, so you’ve identified some helpful statistics — now what?
Now you put in the work; determine your KPI, dig into the data, and see what tweaks can be made to your current strategy. With that in mind, you can assess your own email performance and plan for the future with a grounded perspective.
- Does the design of your email follow best practices?
- Is your email curated to maximize engagement?
- Are you leveraging your subject lines?
- If you’re looking to increase Open Rates, consider these 5 tips
- Have you recently cleaned your email list?
At the end of the day, it’s all about experimenting and analyzing results — then rinse and repeat.