Creating Charts For Better Data Visualization using Charts.js
In today’s data-driven world, it is more important than ever to have accessible ways to view and understand data. Just presenting plain data can sometimes be overwhelming and confusing for an audience. By using data visualization tools such as charts and graphs, we can help the audience better understand the data and simultaneously make it visually appealing.
The traditional way of displaying a chart or a graph on a website was to input the data in a third-party software like Excel, generating the chart, taking a screenshot and then adding that to the site. While this method may still be relevant in some cases, it certainly has its drawbacks and disadvantages, such as having to generate a new screenshot every time the data changes or not having the ability to generate a chart based on user input.
Charts.js is a JavaScript library that can be used to create different kinds of charts based on the data provided. The data could be something that is added in the admin of a site or something that a user inputs into predefined fields on the front-end which then renders a chart.
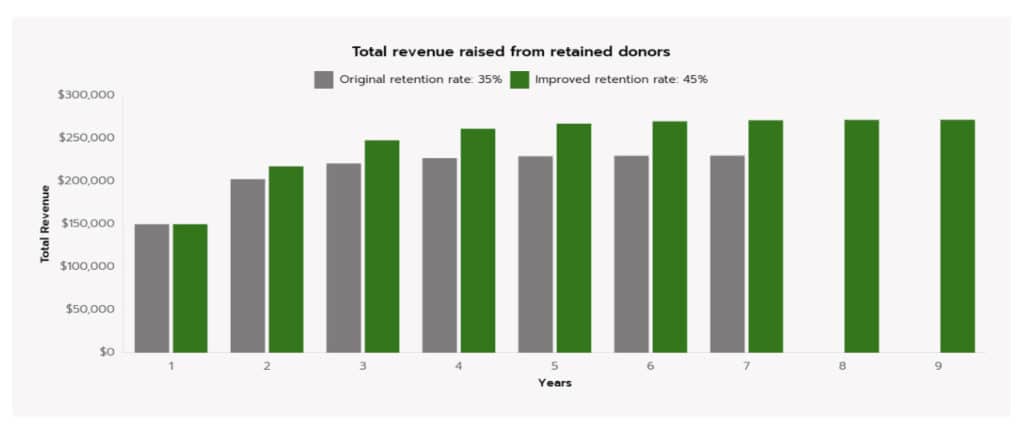
Bloomerang‘s Donor Retention Calculator
Recently, our clients at Bloomerang wanted to create a Donor Retention Calculator, where the user would enter some values into input fields and when submitted, a chart would display based on the input values. We utilized Charts.js to accomplish the generation of chart. Use the calculator here.
Getting Started
In order to use the Charts.js library we need to include it in our HTML file. You can add it using npm, a CDN, or download it from their repository. All the installation instructions can be found here.
Once the library has been added, we need a HTML canvas tag on our page where the chart would be rendered.
<div>
  <canvas id="myChart"></canvas>
</div>
In the example above, we have created a canvas with an id of myChart. We will use the library included above along with the JavaScript added below to render the chart in this location.
<script>
var canvasId = document.getElementById('myChart');.
var barChart = new Chart(canvasId, configObject);
</script>
In the above JavaScript code, we instantiate a new Chart instance which takes two arguments – the canvas element where the chart would be rendered and the configuration object which defines the data and properties of the chart – and assign it to the barChart variable.
The Configuration Object
var configObject = {
  type: ''
  data: {}
  options: {}
  plugins: []
}
This is the top level structure of the configuration object that is used to render the chart. The type property accepts a string and determines the type of chart that is going to be rendered. The type property could be bar, line, bubble, doughnut, pie, polarArea, radar or scatter.
The data property of the configuration contains label and data properties which are used to generate the chart. This is where we will be passing an array of data, either from user inputs or from the site admin, and updating the chart based on those inputs.
The options property of the configuration controls the look and functionality of the generated chart.
The plugins property is used to add inline plugins for the chart which can be used to customize or change the default behavior of the chart.
var configObject = {
  type: 'bar',
  data: {
    labels: ['Red', 'Blue', 'Yellow', 'Green', 'Purple', 'Orange'],
    datasets: [{
      label: '# of Data',
      data: []
    }]
  },
  options: {
    scales: {
      y: {
        beginAtZero: true
      }
    }
  }
});
The above configuration object would be added before instantiating the new Chart instance. This would create an empty bar chart.
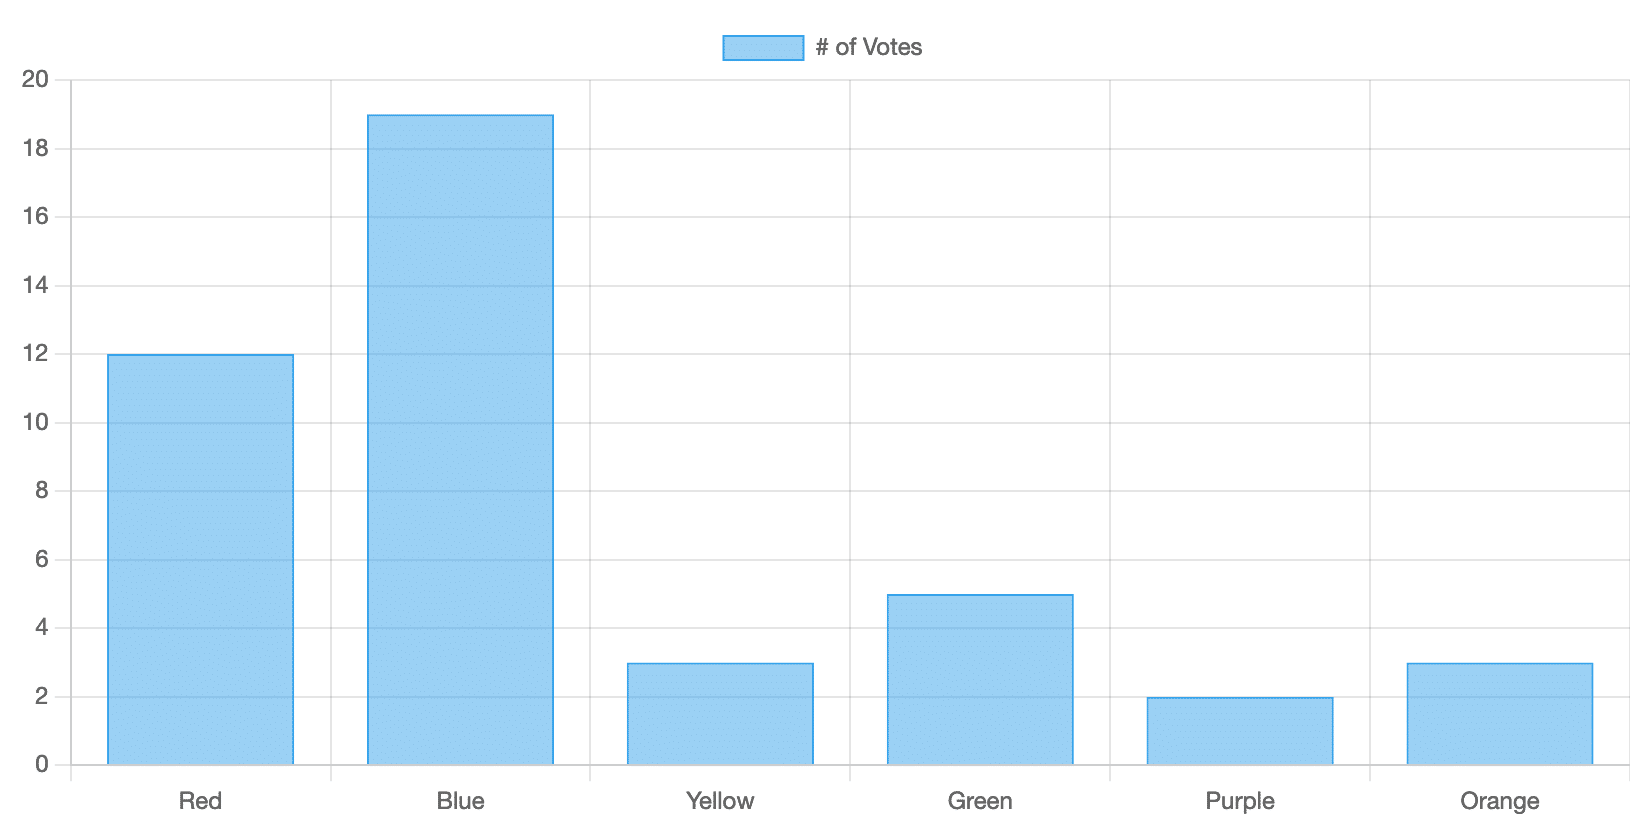
var dataArray = [12, 19, 3, 5, 2, 3];
barChart.data.datasets[0].data = dataArray;
barChart.update();
In the above code, we create an array of data from user inputs or admin inputs and update the data in the configuration object’s dataset. Since we are still displaying an empty chart with no data, in the last line, we update the chart by calling the update() function to render a bar chart with the newly provided data.
Besides the basic configuration object properties discussed above, Chart.js does offer an extensive array of properties and features that can be used to customize the look and functionality of the chart based on your need. For a detailed list of all available options and properties, you can view the official documentation here.
If you need help generating or implementing charts on your website, reach out to us.